MAPP EYE
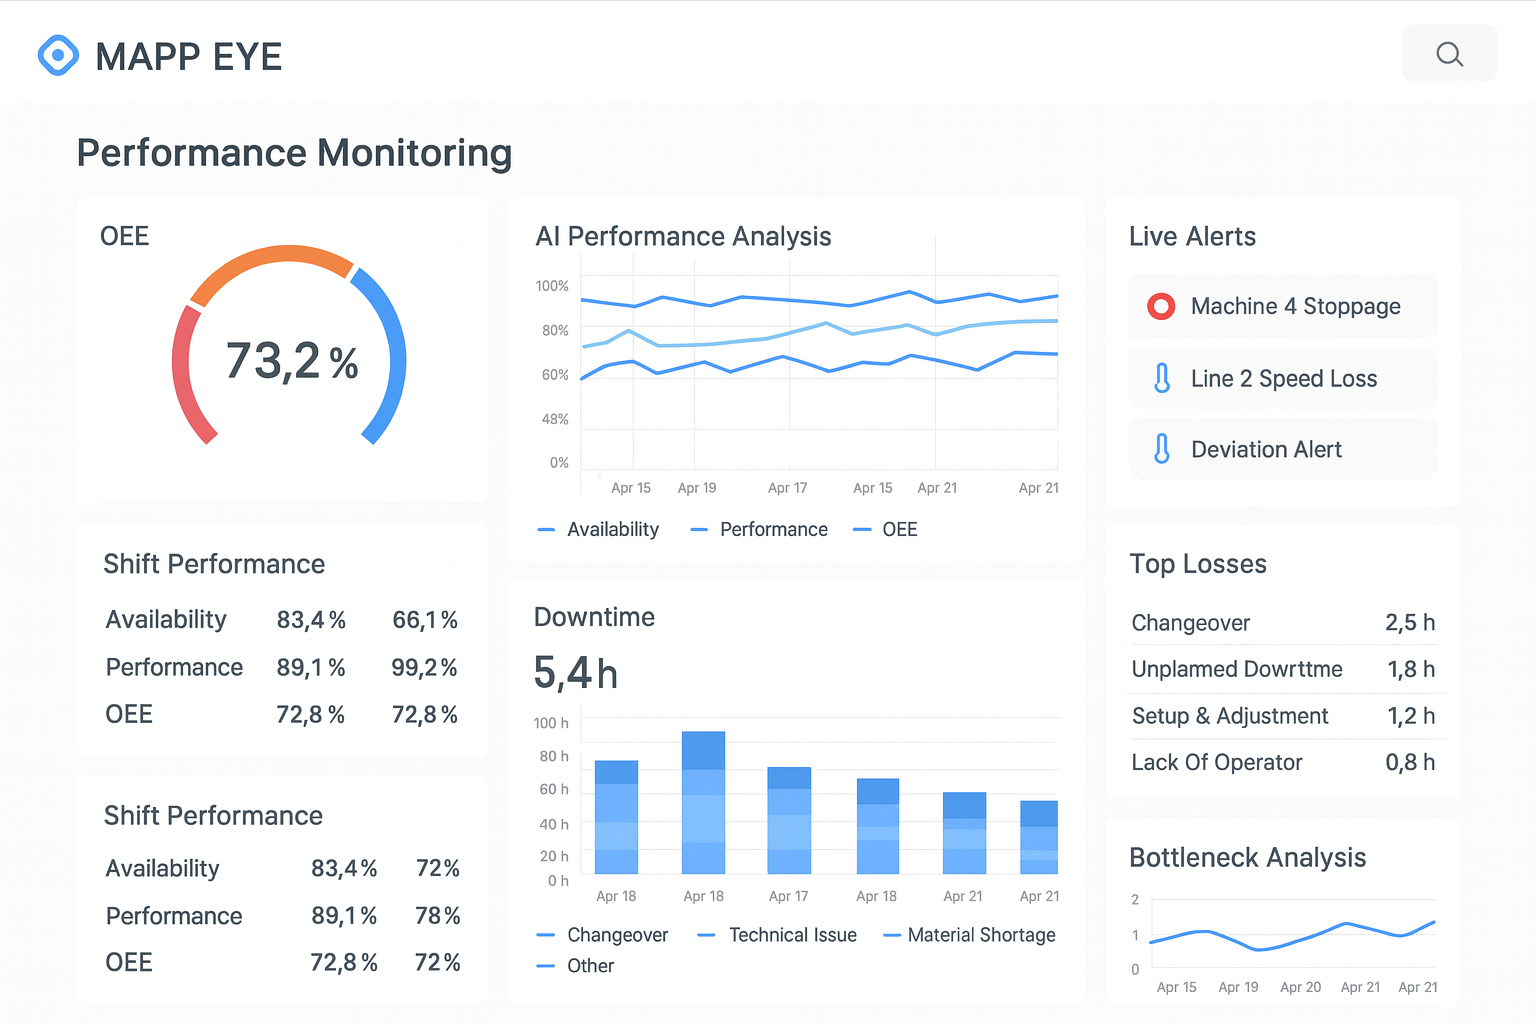
Performance Monitoring
Real-Time OEE. Complete Visibility. Continuous Improvement.
MAPP EYE transforms your shop floor into a transparent, measurable environment with real-time dashboards showing machine status, OEE, production analytics, and fault analysis.
From plant-wide overviews to individual machine deep-dives, MAPP EYE gives operations, maintenance, and leadership teams the visibility they need to drive productivity.
Part of the MAPP IIoT Platform—connecting machines, people, and processes for Industry 4.0.
Why MAPP EYE?
Most manufacturers don't know their true OEE. Production data is trapped in machines, collected manually on paper, or sits in disconnected spreadsheets. MAPP EYE changes this.
MAPP EYE Delivers:
Key Features
OEE Calculation & Visualization
Automated real-time OEE (Overall Equipment Effectiveness) calculation with intuitive visual dashboards.
Know your true OEE—automatically calculated, not manually estimated.
Custom Dashboards
Configurable dashboards for different roles—from operators to plant managers.
Every stakeholder sees exactly what they need.
Alerts & Notifications
Real-time alerts for faults, stoppages, and performance deviations—never miss a critical event.
Respond to issues in minutes, not hours.
Identify Causes for Productivity Loss
Drill down into the specific reasons behind production losses with detailed breakdown analysis.
Stop guessing—know exactly where you are losing productivity.
AI-Powered Analytics
Advanced analytics powered by AI to predict trends and provide actionable insights.
Move from reactive to predictive manufacturing intelligence.
Line Efficiency Comparison
Compare performance across lines, shifts, and time periods to identify best practices.
Learn from your best performers and replicate success.
Bottleneck & Root Cause Analysis
Identify production bottlenecks and drill down to root causes with Pareto analysis.
Eliminate your biggest productivity killers systematically.
Comprehensive Reporting
Generate actionable reports from daily summaries to monthly trends for all stakeholders.
From shop floor to top floor—reports for every stakeholder.
Business Benefits
15-25% OEE Improvement
Visibility into losses enables targeted improvement actions.
40% Reduction in Downtime
Faster response to faults and proactive maintenance reduces unplanned stops.
Real-Time Visibility
Instant access to production status from anywhere, anytime.
Data-Driven Decisions
Replace gut-feel with accurate, real-time production analytics.
Operator Accountability
Transparent metrics drive better performance across all shifts.
Ideal For
Discrete Manufacturing
Automotive & Auto Components
CNC Machining & Job Shops
Plastics & Injection Molding
Sheet Metal & Fabrication
Assembly Lines
Ready to See Your Real OEE?
Transform your shop floor with real-time performance monitoring and analytics.