A Solar Module Plant Was Losing Production Every Day. The Data Was Right There in the Machine.
Not every production loss announces itself. Some arrive in the form of a process that is slightly off - a temperature a few degrees higher than it should be, a fault count that trends slowly upward across three weeks. By the time these losses are visible as output numbers, the cause has usually been present for a long time.
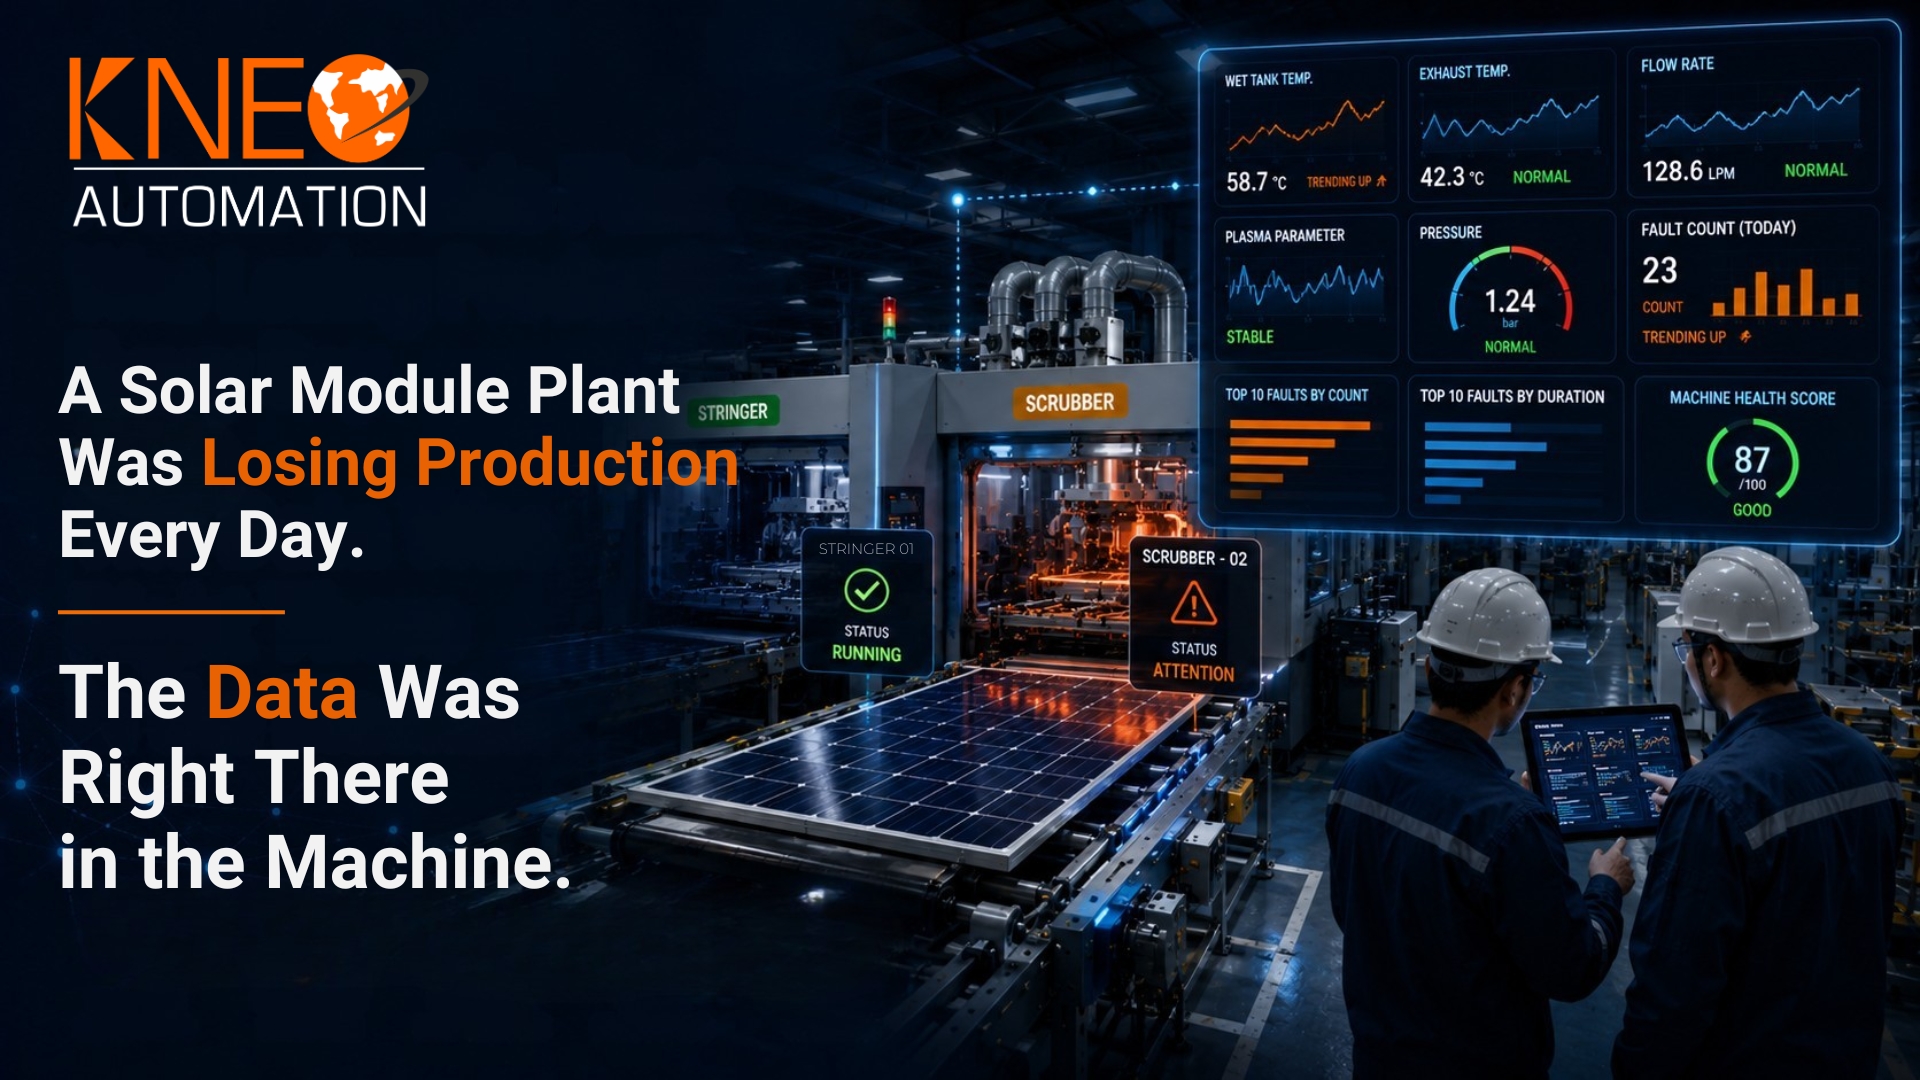
The Challenge With Quiet Losses
Solar module manufacturing is a process-intensive environment. Scrubber and stringer machines run continuously, managing chemical and thermal processes within narrow parameter windows. A deviation that stays within the machine's alarm threshold does not trigger a response. It simply accumulates. At this plant, the difficulty was tracking real-time production across the scrubber units specifically. Faults were occurring. The aggregate effect on output was measurable in the weekly production report. But the specific mechanism - the signal pattern that, if read correctly, pointed to the cause - was buried in machine data that nobody was reading in real time.
What Real-Time Parameter Monitoring Reveals in Process Equipment
The IIoT deployment monitored wet tank temperatures, exhaust temperatures, plasma parameters, flow rates, pressure readings, and fault codes across the stringer and scrubber units simultaneously. The fault count dashboard tracked events by frequency and duration, not just occurrence. Two things became visible almost immediately. First, the scrubber units were experiencing asymmetric temperature distribution during specific product runs — a pattern invisible in the aggregate temperature reading but clear when individual zone data was charted over time. Second, a small cluster of fault codes accounted for a disproportionate share of total downtime duration. Not the most frequent faults. The longest ones. These were not equipment failures in the traditional sense. They were process conditions that, left unaddressed, reliably produced extended recovery times.
The Difference Between Reactive and Proactive Maintenance
The before and after here is precise. Before deployment: a fault occurs, a machine stops, a technician is called, a root cause is identified, a repair is made, production resumes. Elapsed time: variable, often significant. After deployment: a parameter begins trending toward the threshold historically associated with a fault. An alert is generated. A technician investigates and intervenes before the fault occurs. Elapsed time: planned, minimal, absorbed into scheduled maintenance. The equipment uptime improvement was a direct function of this timing difference. Nothing else changed.
Energy and Cost Visibility as an Unexpected Benefit
The energy analysis module in the deployment was not the primary objective. It became a productive secondary one. Process runs that consumed significantly more energy than their output justified became visible for the first time. This was not a reporting capability. It was an optimisation signal. Process engineers could now identify which run conditions were energy-inefficient, understand why, and adjust parameters to close the gap. The financial implication was material. The mechanism was simple: connect energy consumption data to production output data and let the ratio tell you where to look.
The data that prevents your next unplanned stoppage is already inside your machines. The question is whether you are reading it. www.kneo.in